
The Metriweave guide
How to view your Apple Health data over time.
A single reading is a snapshot. Looking across days, weeks and months gives you more context. Here’s how to choose a useful view, compare periods and check what’s behind the numbers.
Start with the current Day, Week and Month views for free. Longer history, comparison charts, Trends and individual source filtering require Metriweave Pro.
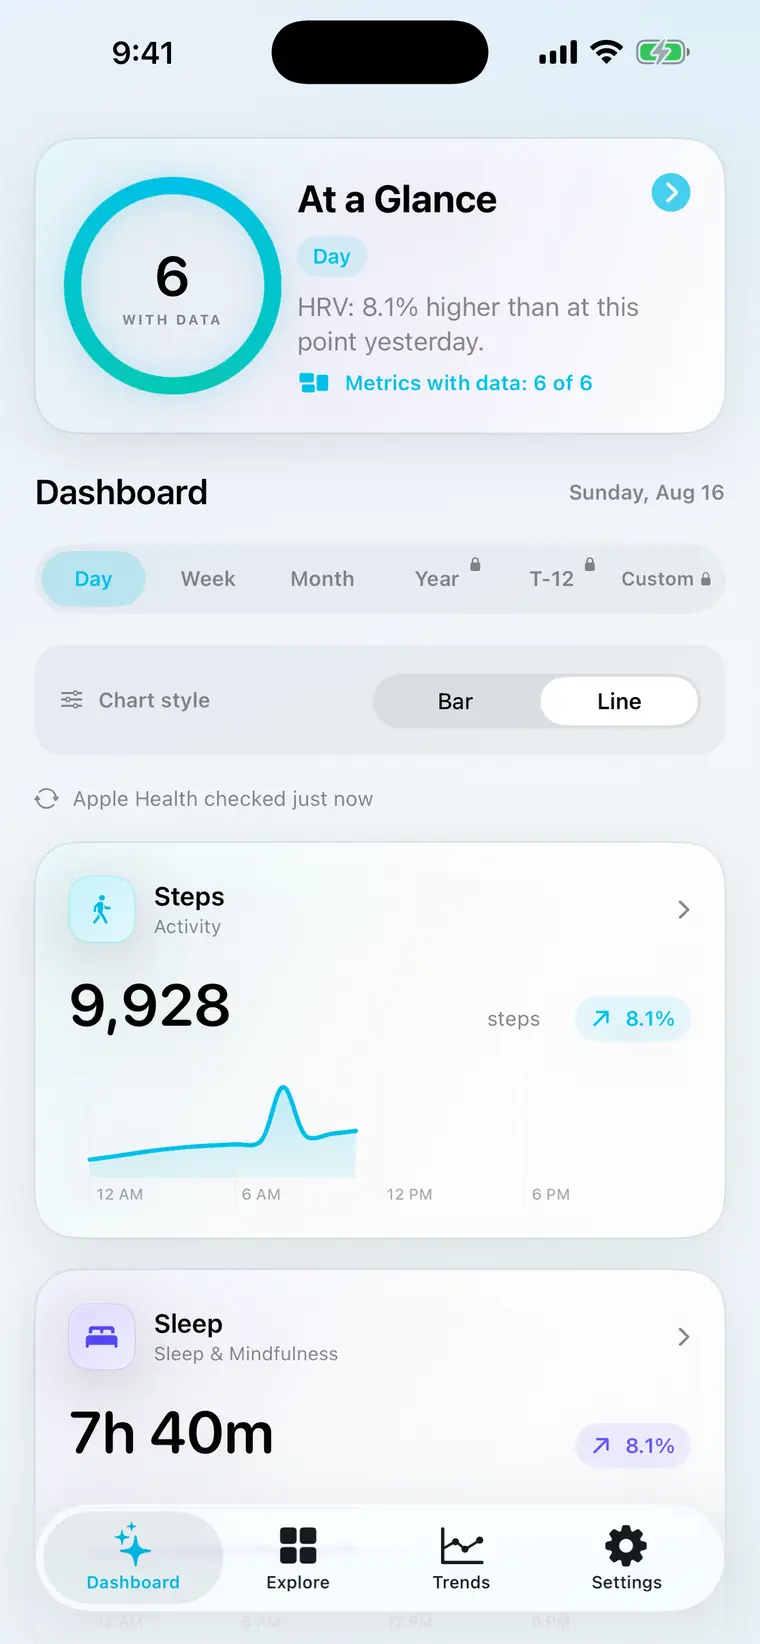
Build 47 · Demonstration data
01 · Getting started
Start with the measurements you care about.
- Allow access to Apple Health. Open Metriweave and follow the access prompts. Choose the supported measurements you want to make available.
- Open Explore. Search for a measurement or browse a category, then turn on its switch. In version 2.4.1, these switches update your dashboard immediately.
- Return to Dashboard. Choose Day, Week or Month, then tap a card to open its chart and details.
A manageable starting point might be Steps, Sleep and Resting Heart Rate—if you have records for them. You can change the selection later.
02 · Find the right scale
Choose the range that fits your question.
Use the time-frame selector on Dashboard or a measurement’s detail screen. A day view helps you inspect one day; a longer view helps you see changes across recorded periods.
| Time frame | Use it to explore | Availability |
|---|---|---|
| Day | Readings or activity within the selected day. | Free: current day |
| Week / Month | How values vary across the selected week or month. | Free: current period |
| Year | A selected calendar year. | Pro |
| T-12 | Eleven completed calendar months plus the current month so far. | Pro |
| Custom | A date range you choose. | Pro |
Going back to earlier days, weeks or months also requires Pro. T-12 can cross a year boundary; it is not an exact rolling 365-day window. Specialized views may offer a different set of time frames.
03 · Look at the change Pro
Compare one period with the one before it.
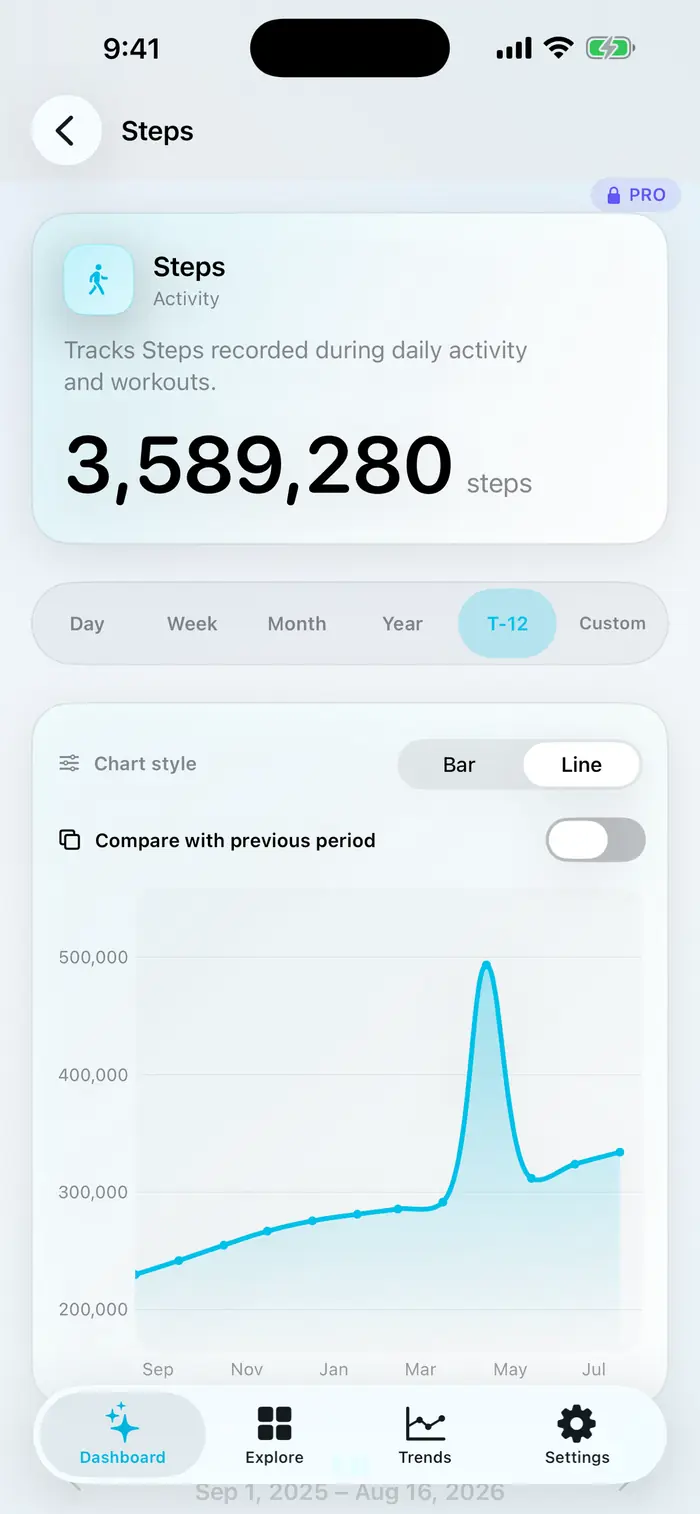
Open Steps, select the time frame you want to explore, and turn on Compare with previous period. This control is available on supported numeric charts, but not every type of measurement.
For a period still in progress, Metriweave compares the same elapsed portion of the previous period. A partly completed month is not automatically compared with the whole of the previous month.
For example, if you’re checking your activity halfway through a month, read the comparison dates before interpreting the percentage change. Then check that both periods have enough recorded data to make the comparison useful.
On supported charts, tap or press and hold to inspect a value and its date. Where available, switch between Bar and Line to choose the view you find easier to read.
04 · Check the context
Before drawing a conclusion, look at the records.
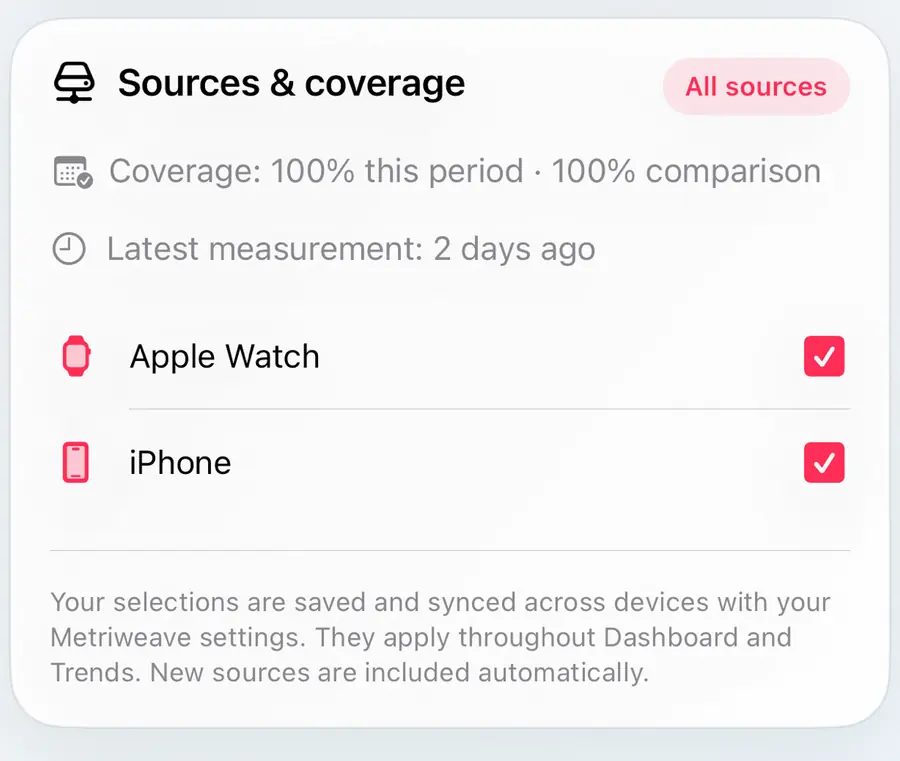
Scroll down inside a measurement’s detail screen to Sources & coverage. This helps you see where the records came from and how much of each period contains readings.
- Check both periods’ coverage.
- Coverage describes intervals with readings. It is not a health score or the percentage of time you wore a device. An occasionally recorded measurement can have low coverage without being invalid.
- Check which sources are included.
- Free includes all available sources. With Pro, use the source checkboxes to select individual apps or devices. The selection applies throughout Dashboard and Trends; new sources are included automatically.
- Treat a gap as a gap.
- No displayed reading is not the same as a recorded zero. Before interpreting a drop, check whether records are missing or a contributing source is excluded.
05 · Explore more history Pro
Use Trends to look across your measurements.
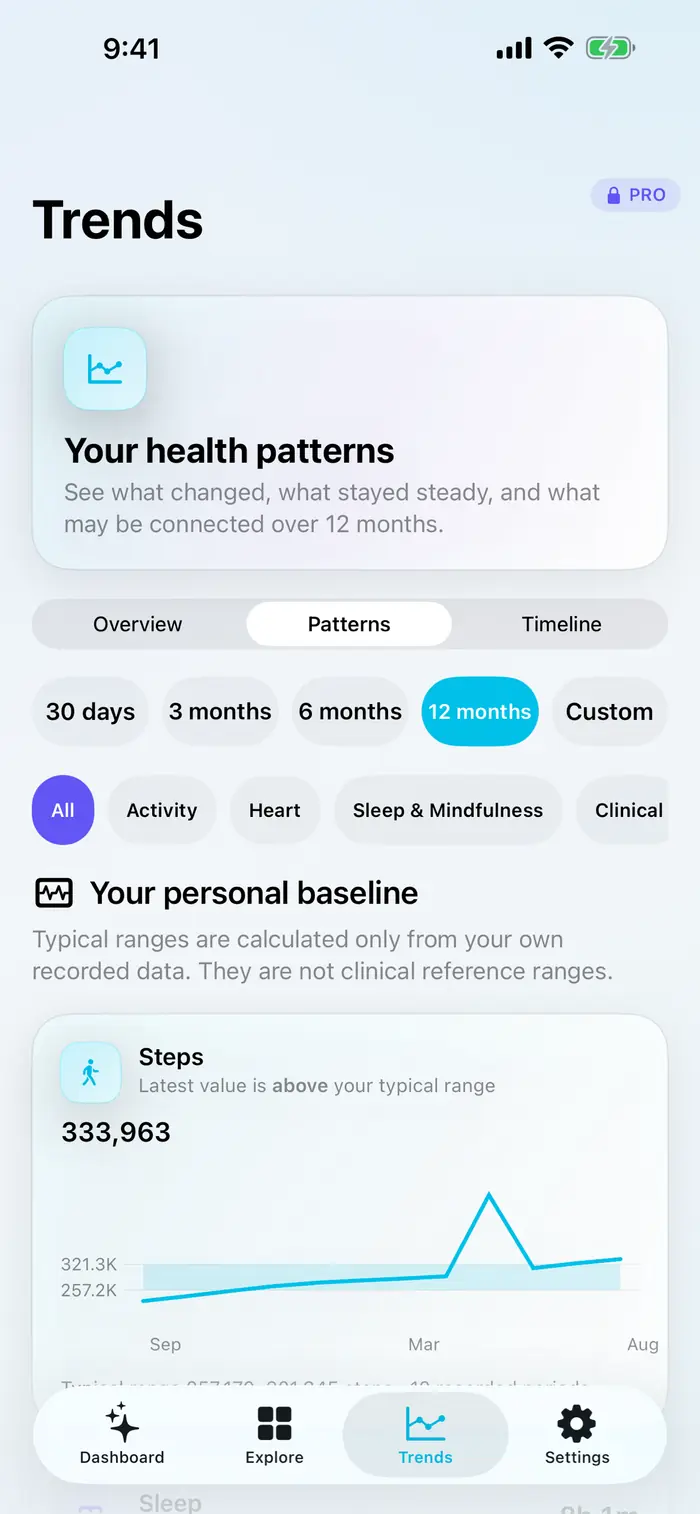
Open the Trends tab and choose 30 days, 3 months, 6 months, 12 months or Custom. Trends uses the measurements selected for your dashboard; add another in Explore if you want it included.
- Overview
- Start here for notable changes, relatively steady measurements and measurements that need more data.
- Patterns
- Explore your personal baseline and supported relationships or repeating patterns. Some observations need more overlapping history before they can appear.
- Timeline
- Review detected changes in date order, then open a measurement for more context.
06 · A little more context
Questions that come up along the way.
Why does a sleep chart change when I choose a longer range?
In Day, Metriweave uses a noon-to-noon sleep day, so a typical overnight session is assigned to the date you woke up. Week and Month show recorded-night totals.
In Year and T-12, each month’s chart value is average sleep per recorded night—not total hours slept that month. Missing nights are not counted as zero sleep. Non-overlapping naps and split sleep can also contribute.
What if Apple Health has data but Metriweave looks empty?
Check the measurement and selected dates first, then review Metriweave’s access in Apple Health. If you use Pro source filtering, confirm that the source containing those readings is included. Return to Metriweave and refresh.
Apple does not tell apps whether Health read access was denied, so an empty result alone cannot identify the cause. See Apple’s guide to Health data and app access for permission controls.
Why doesn’t a number match another health app?
Compare the same measurement, dates, units and sources. Check whether each app is showing a total, an average or a latest reading. Sleep-day boundaries and the way records are grouped can also differ.
If a difference still looks wrong, contact support with the measurement, dates and steps to reproduce it. You do not need to send your full Health history.
Does an “Unusual periods” flag mean something is wrong?
Not necessarily. In a measurement’s detail screen, Data quality → Unusual periods identifies chart values that sit well outside the statistical pattern of other values in the selected range. Its explanations come from a fixed calculation, not generative AI.
Use a flag as a reason to inspect the data and its sources. It is not a diagnosis and cannot establish the cause of a change.
Can I explore charts with VoiceOver or larger text?
Metriweave supports Dynamic Type and VoiceOver. Common metric charts provide actions including Next reading, Previous reading and Clear selected value. Enhanced chart contrast is available in Free and Pro.
Visit the accessibility page for supported features and setup information.